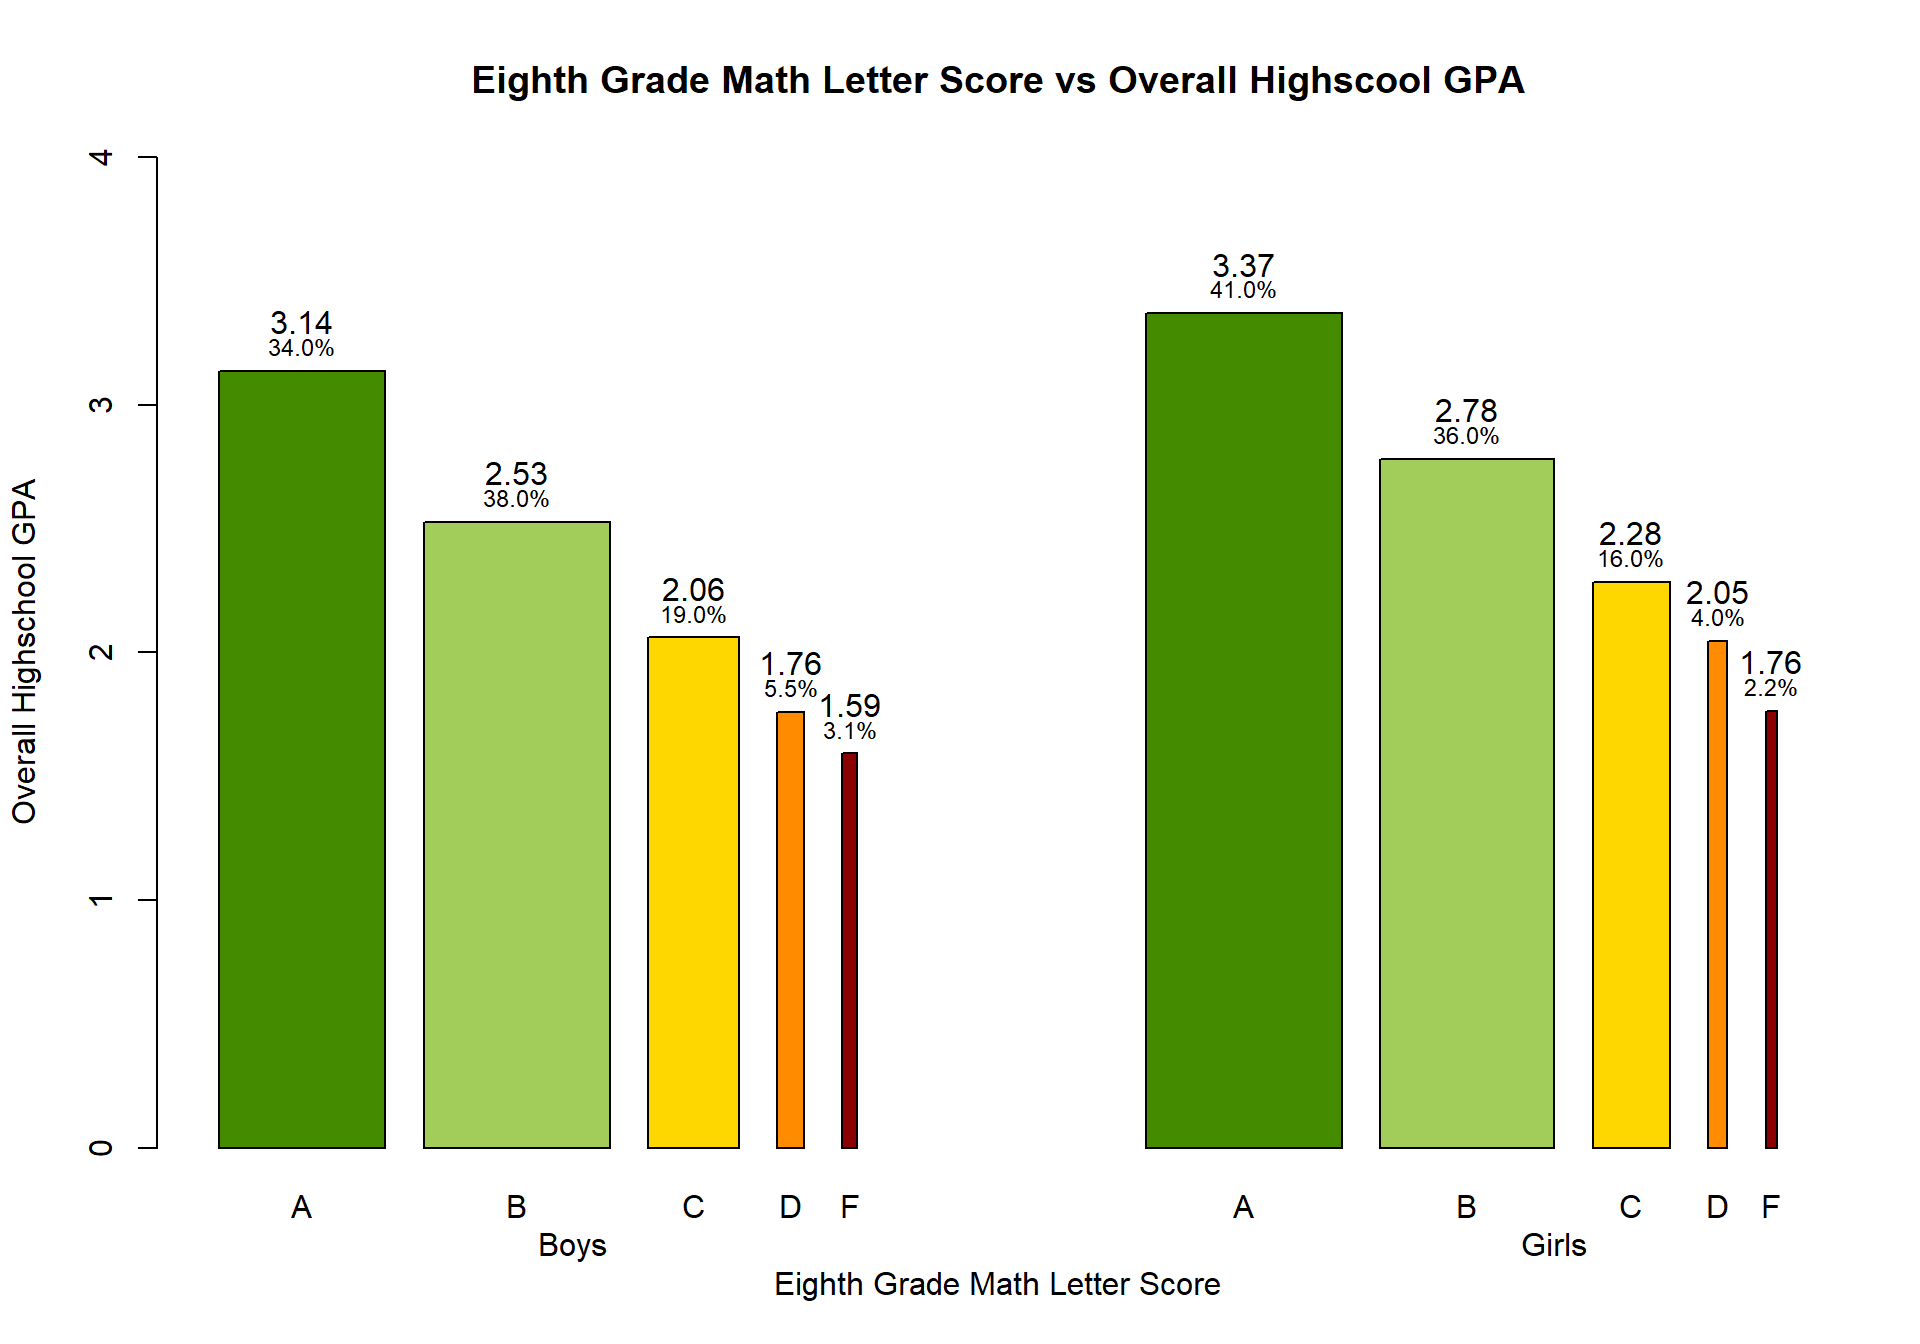
library(scales)Dt <-load(url("https://github.com/aldenfelix/aldenfelix.github.io/raw/main/Data/assign04.RData"))##Load column namesBar<-data.frame(rep(0,10))Bar[,1:2] <-cbind(rep(c("Boy", "Girl"), each =5),rep(c("A","B","C","D","F"),2)); Bar[,1] <-paste(Bar[,1],Bar[,2]); Bar[,2] <-rep(c(0,1), each =5); Bar[,3] <-rep(c("A","B","C","D","F"),2)x <-cbind(aggregate(OGPA ~ Sex + EMSC, data = data, FUN = mean))Bar[,4] <- x[c(1,3,5,7,9,2,4,6,8,10),3]x <-cbind(aggregate(OGPA ~ Sex + EMSC, data = data, FUN = length))Bar[,5] <- x[c(1,3,5,7,9,2,4,6,8,10),3]Plot <-barplot( height = Bar[,4], names = Bar[,3], width =2* Bar[,5]/max(Bar[,5]), space =c(.4,.4,.4,.4,.4,3,.4,.4,.4,.4),xlab ="Eighth Grade Math Letter Score", ylab ="Overall Highschool GPA", ylim =c(0, 4), main ="Eighth Grade Math Letter Score vs Overall Highscool GPA",col =rep(c("chartreuse4", "darkolivegreen3", "gold", "darkorange", "darkred"),)) text(x = Plot, y = Bar[,4]+.2, labels =signif(Bar[,4], digits =3))text(x = Plot, y = Bar[,4]+.1, labels =percent(c(signif((Bar[1:5,5]/sum(Bar[1:5,5])),2),signif((Bar[6:10,5]/sum(Bar[6:10,5])),2)), accuracy = .1), cex = .75)mtext("Boys", side=1, line=2, at=4); mtext("Girls", side=1, line=2, at=14)
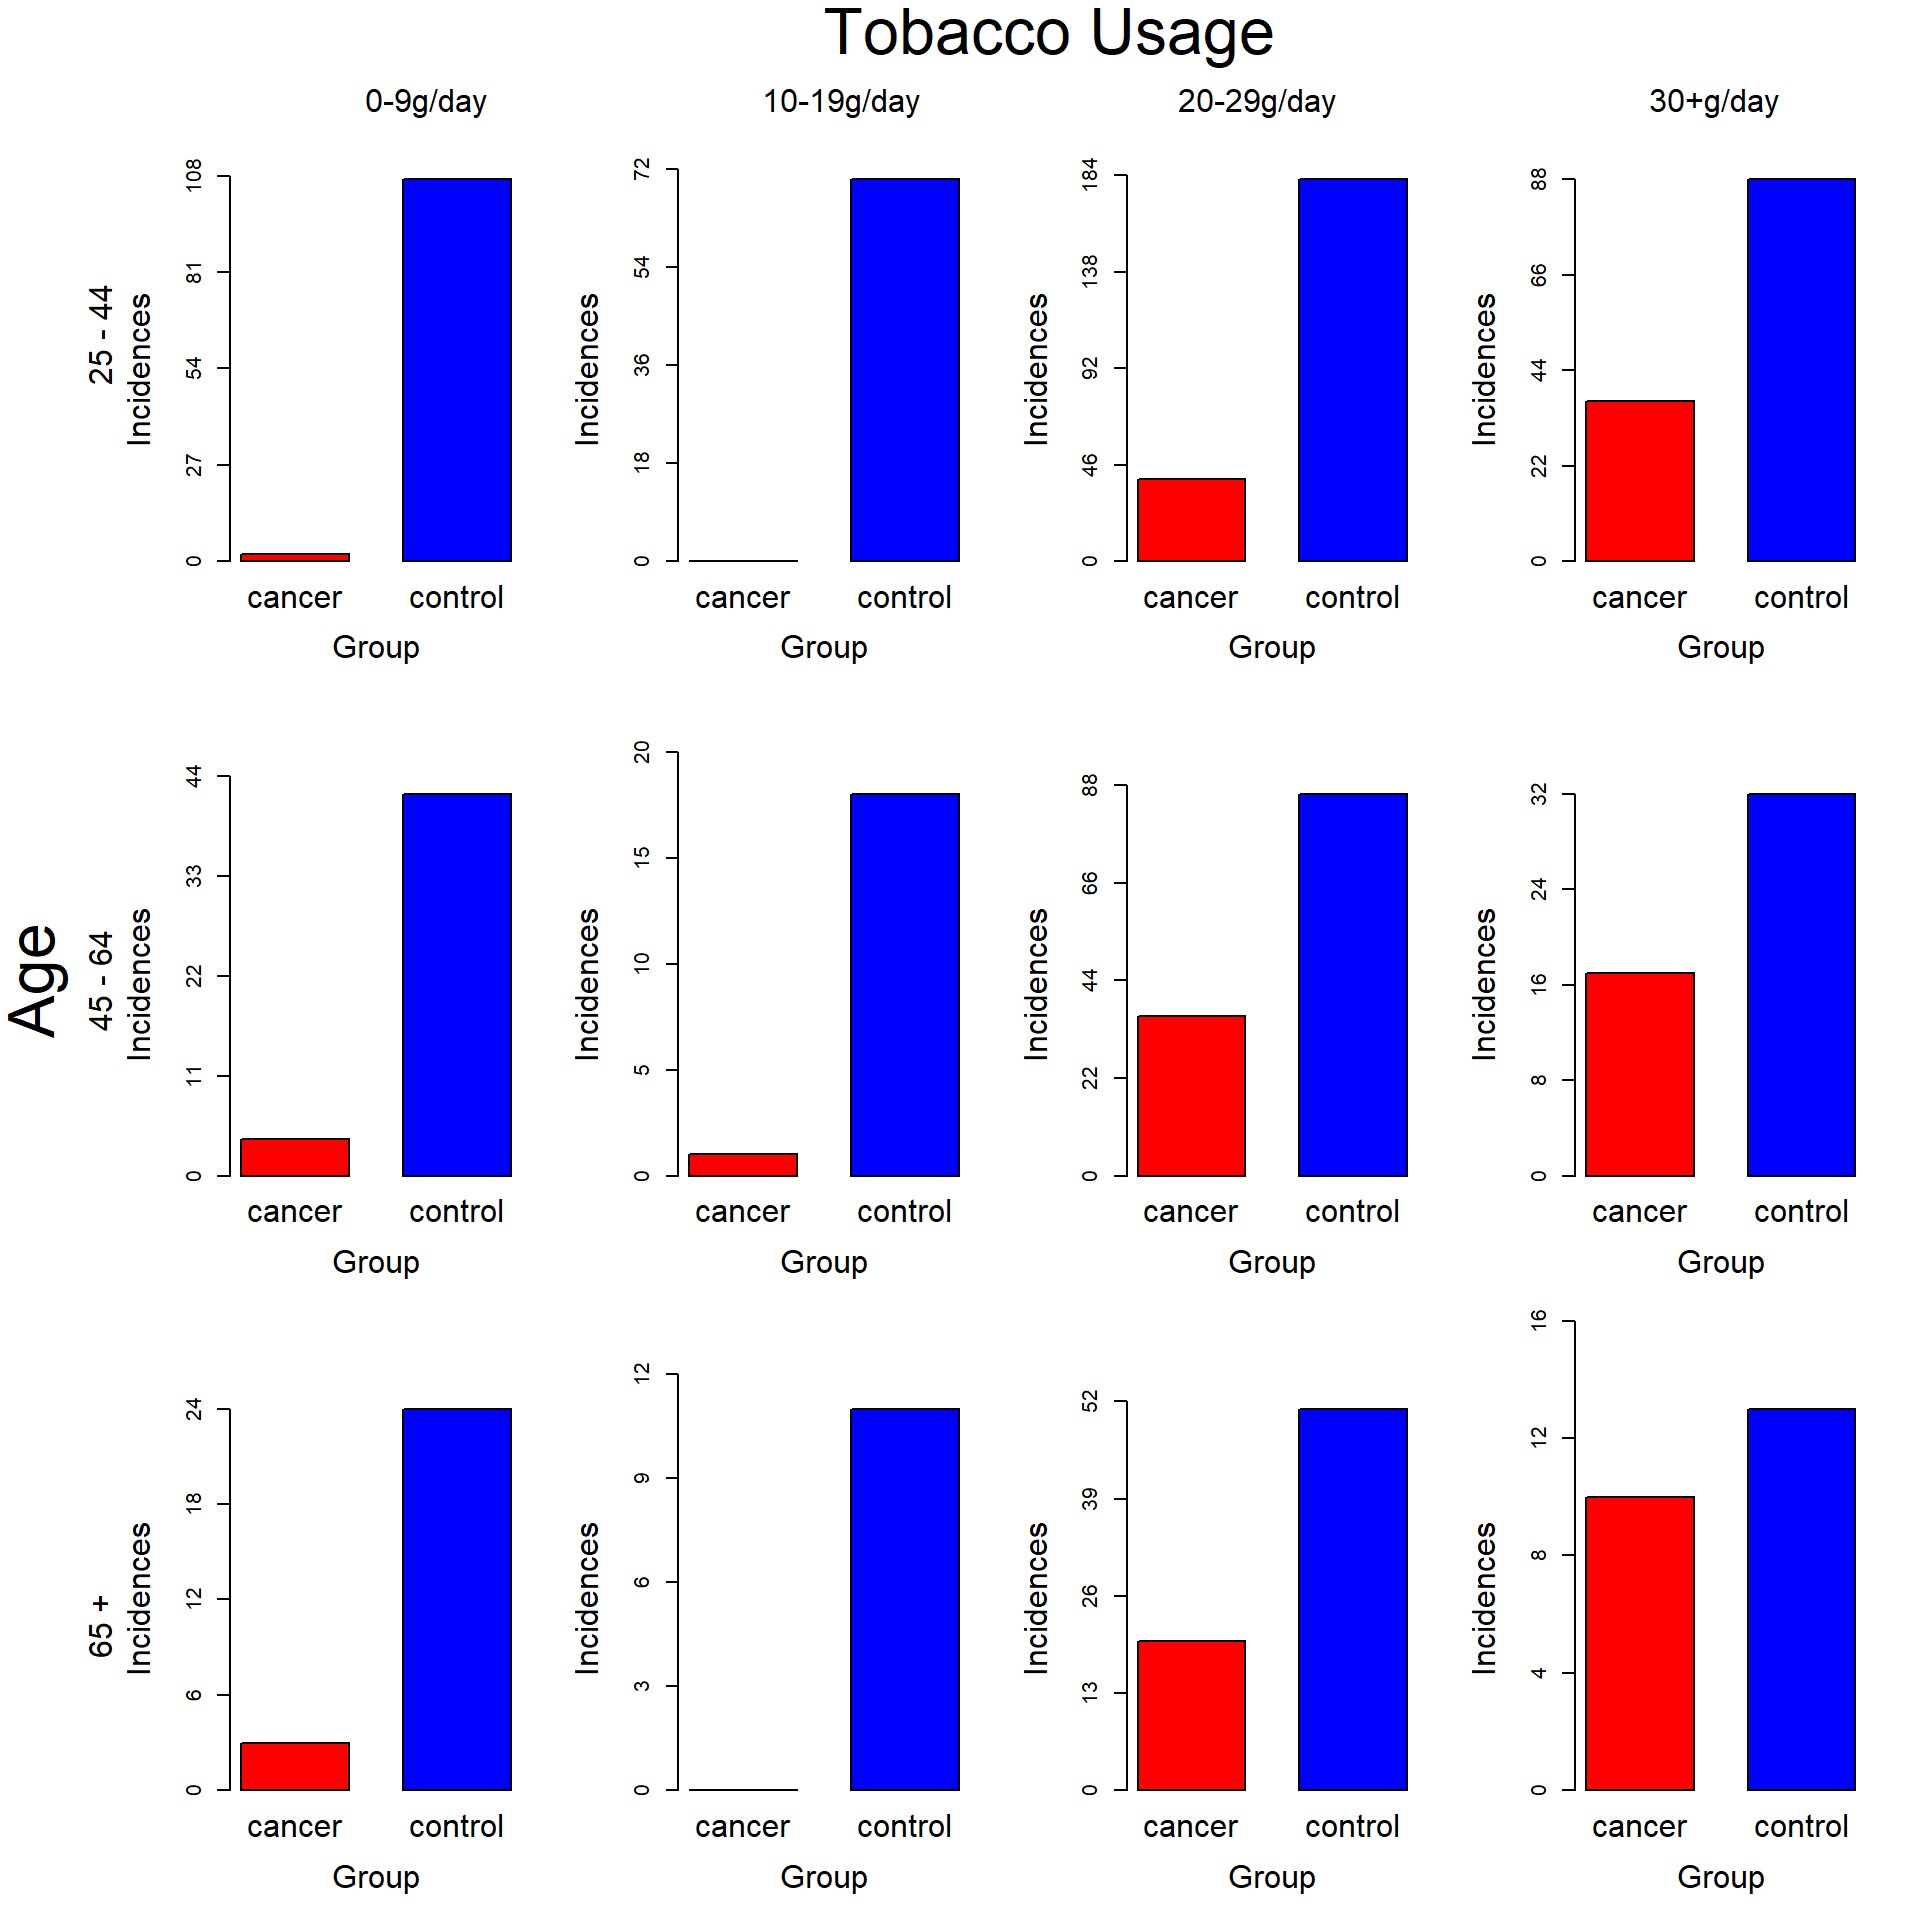
Table with Embedded Charts/Faceted Charts
ecan <- esophecan$tob <-ifelse(ecan$tobgp =="0-9g/day", "0-9",ifelse(ecan$tobgp =="10-19", "10-19",ifelse(ecan$tobgp =="20-29", "20-29", "30+")))ecan$agp <-ifelse(ecan$agegp =="25-34", "25-44",ifelse(ecan$agegp =="35-44", "24-44",ifelse(ecan$agegp =="45-54", "45-64",ifelse(ecan$agegp =="55-64", "45-64", "65+"))))Cdat <-aggregate(ncases ~ agp + tob, data = ecan, FUN = sum)Cdat[,4] <-aggregate(ncontrols ~ agp + tob, data = ecan, FUN = sum)[,3]par(mfrow =c(3,4), oma =c(0,5,3,0))for(i in1:12){ Plot <-barplot(height =as.numeric(Cdat[i,3:4]), names =c("cancer", "control"), space =0.5,xlab ="Group", ylab ="Incidences", ylim =c(0,max(Cdat[i,3:4])/4)*4, yaxp =c(0,ceiling(max(Cdat[i,3:4])/4)*4, 4), col =c("red","blue"), cex.axis =1, cex.names =1.5, cex.lab =1.5)}par(mfrow=c(1,1))mtext("Tobacco Usage", side =3, line =5.5, at =1.5, cex =2)mtext("0-9g/day", side =3, line =4, at =0)mtext("10-19g/day", side =3, line =4, at =1)mtext("20-29g/day", side =3, line =4, at =2)mtext("30+g/day", side =3, line =4, at =3.1)mtext("Age", side =2, line =7.5, at =6.5, cex =2)mtext("25 - 44", side =2, line =6, at =14)mtext("45 - 64", side =2, line =6, at =6.5)mtext("65 +", side =2, line =6, at =-1)